The upcoming Existing Home Sales (EHS) report from the National Association of Realtors (NAR), a comprehensive monthly overview of the sales volume and pricing dynamics of the pre-owned housing market, is projected to report a dip in housing prices.

A point of confusion may arise, considering the abundant reports suggesting that housing prices have steadied and taken a positive turn with median home price.
Why this divergence in the reported trend of home prices? The answer lies in the distinct methodologies used for different reports. NAR bases its analysis on median sales price, while certain other reports use the repeat sales method. The distinction between the two is essential.
As explained by the Center for Real Estate Studies at Wichita State University:
The median sale price signifies the ‘central’ value of homes sold, indicating that half of the homes are sold for a higher price and the rest for a lesser value… For instance, if the recent sales trend shows a predominance of lower-priced homes, the median sale price will show a decrease (as the ‘central’ home is now a lower-priced one), regardless of the increasing value of each individual home.
On the other hand, Investopedia provides a clear understanding of repeat sales method:
Repeat-sales methods evaluate the change in home prices based on the sales of identical properties, bypassing the issue of factoring in price differences in homes with diverse characteristics.
Understanding the Median Sales Price Today
As highlighted by the explanations above, these two methodologies can paint drastically different pictures. That is why, despite numerous reports showing appreciation of prices based on repeat sales, data from median price like EHS may show a decline.
Bill McBride, writer of the Calculated Risk blog, encapsulates this difference:
Median prices are impacted by the mix and repeat sales indexes like Case-Shiller and FHFA are more suitable for measuring prices.
Consider the concept of median value (see visual below) for better understanding. If you possess three coins, arranged from lowest to highest value, and these coins are one nickel and two dimes, the median value (the middle one) is 10 cents. If instead, you have two nickels and one dime, the median value becomes five cents.
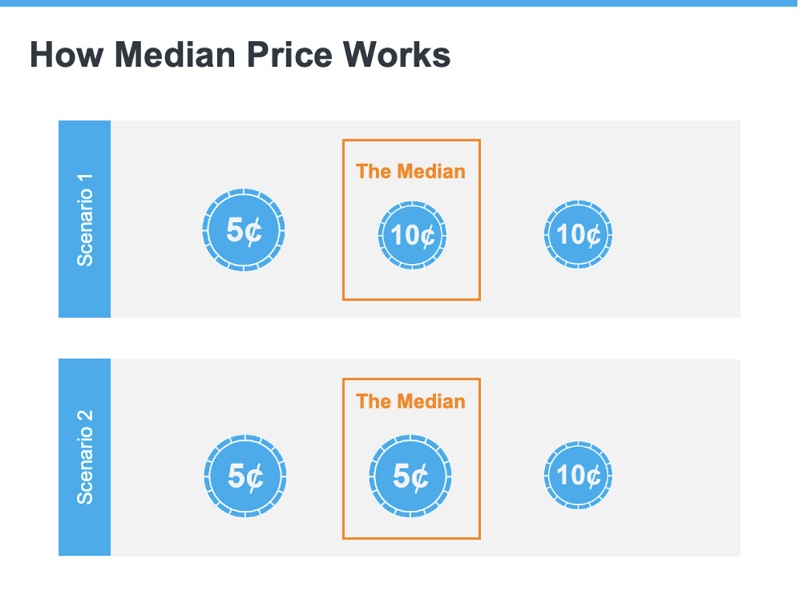
However, the value of each coin, whether it’s a nickel or a dime, remains the same in both scenarios.
Hence, the present scenario isn’t ideal for relying on the median home price as an indicator of home value trends. Most potential buyers begin their home purchase journey by assessing whether the prices align with their budgets.
But the affordability of a home is usually decided by the monthly mortgage payment that buyers can manage, not merely the house price. As mortgage rates rise, buyers may have to settle for a less expensive home to keep their monthly expenses manageable.
The current surge in sales of ‘less-expensive’ homes, causing a decline in median price, doesn’t necessarily imply a decrease in the value of individual houses.
So, when you come across headlines this week announcing falling home prices, recall the coin analogy. A change in the median price doesn’t equate to falling home prices. It merely reflects how the blend of homes sold is influenced by affordability and prevailing mortgage rates.
What We Say…
For a deeper understanding of home price trends and reports, we encourage you to contact us at Debbie@SandiandDebbieHomes.com.
Leave a Reply